
Exploiting soil spectroscopy in the VNIR-SWIR range to estimate soil organic carbon stock: what role can sampling density and spacing play?
All claims expressed in this article are solely those of the authors and do not necessarily represent those of their affiliated organizations, or those of the publisher, the editors and the reviewers. Any product that may be evaluated in this article or claim that may be made by its manufacturer is not guaranteed or endorsed by the publisher.
Authors
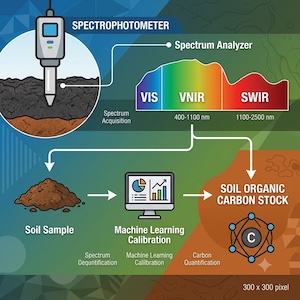
Soil organic carbon stock (SOCS) is a key indicator of soil fertility, ecosystem functioning, and climate change mitigation, yet its direct measurement remains labor-intensive, time-consuming, and costly. Visible, near-infrared, and short-wave infrared (VNIR-SWIR) soil reflectance spectroscopy offers a rapid and cost-effective alternative for SOCS estimation, although its predictive performance may strongly depend on sampling design and landscape heterogeneity. This study investigated the extent to which sampling density, spatial scale and spacing affect the accuracy of spectroscopy-based SOCS prediction. An ensemble modeling framework integrating partial least squares regression (PLSR), random forest (RF), and artificial neural networks (ANN), combined with five spectral pre-processing techniques, was applied to two contrasting datasets collected in southern Italy. The first dataset represented the entire heterogeneous region of Campania (CAM), comprising 2,957 topsoil samples collected on a sparse irregular grid with spacing ranging from 1 to 4 km. The second dataset corresponded to a local experimental field (MFC2, 8 ha), where 135 topsoil samples were collected on a dense regular grid with 25 m spacing. Model performance was evaluated using independent validation datasets through the coefficient of determination (R²), root mean square error (RMSE), and residual predictive deviation (RPD). Marked differences emerged between spatial scales. A fair predictive performance was achieved at MFC2 (best model: R² = 0.65; RPD = 1.71), whereas all models performed poorly at the regional CAM scale (best model: R² = 0.24; RPD = 1.14). Variogram analysis showed greater unresolved spatial variability (nugget effect) in the CAM dataset, indicating that the sparse regional sampling design failed to adequately capture fine-scale SOCS heterogeneity. To further investigate the role of sampling density, a denser subset of 130 CAM soil samples, with approximately 1 km spacing, was analyzed. Although model performance improved moderately (best R² = 0.35), predictive accuracy remained unsatisfactory (RPD <1.5), confirming that increased sampling density alone can be insufficient in highly heterogeneous regional landscapes. Overall, these findings demonstrate that sampling design and spatial heterogeneity are dominant factors controlling the reliability of spectroscopy-based SOCS estimation, emphasizing the adoption of spatially optimized sampling strategies to support robust regional soil carbon monitoring and assessment.
Downloads
Citations
Supporting Agencies
European Union - Next-GenerationEU - National Recovery and Resilience PlanData Availability Statement
The data used to support the findings of this study are available from the corresponding author on reasonable request.
How to Cite

This work is licensed under a Creative Commons Attribution-NonCommercial 4.0 International License.